Sales Productivity
LinkedIn Prospecting Metrics: What SDRs Should Track in 2026
Track the right LinkedIn prospecting KPIs: 10-20 meetings/month, 15-25% acceptance rates, 10%+ response rates. Complete SDR metrics guide with benchmarks.
8 min read
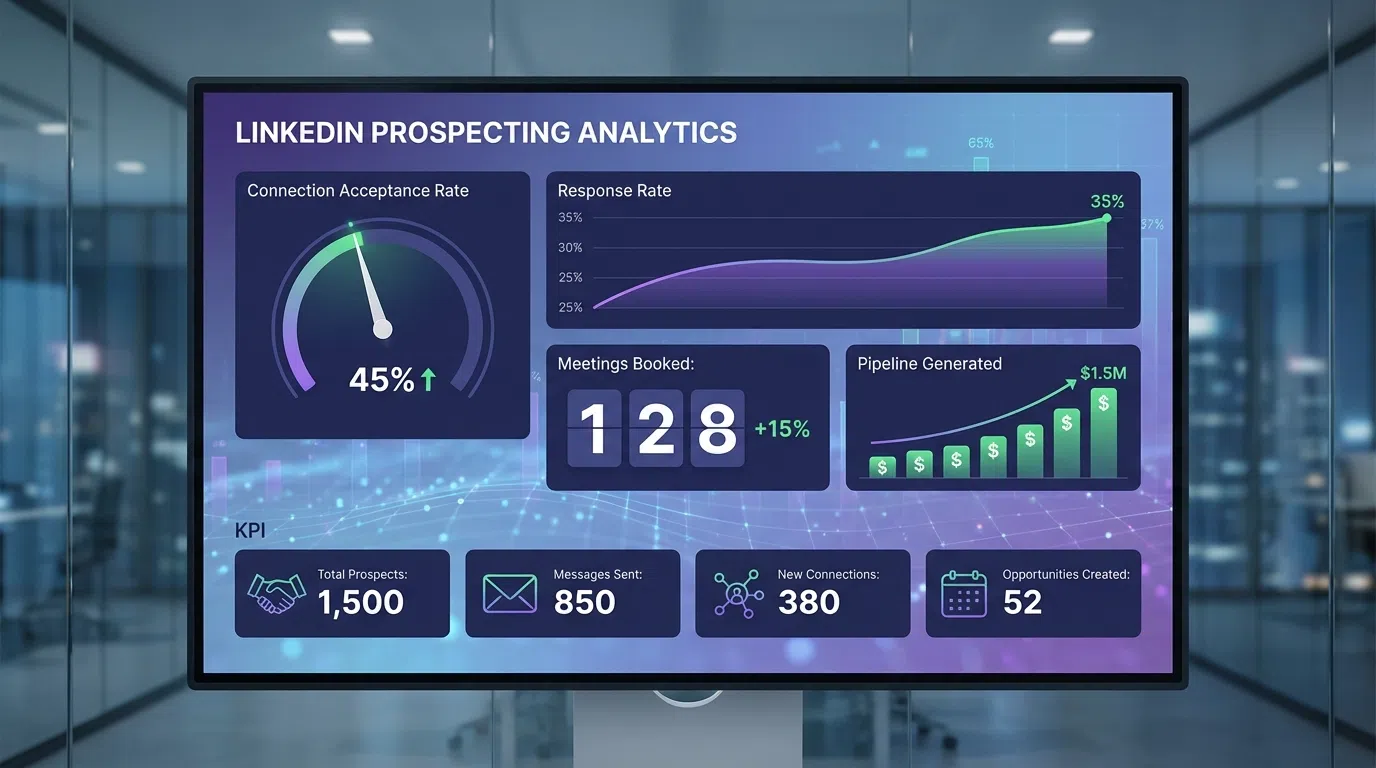
You can't improve what you don't measure. Yet most SDRs track vanity metrics like "messages sent" instead of outcomes that actually matter: meetings booked, pipeline generated, and deals closed. Sales professionals with strong Social Selling Index (SSI) scores have 45% more sales opportunities than those with weak scores, but SSI is just one of many critical metrics.
The difference between top-performing SDRs (booking 15-25 meetings monthly) and struggling reps (5-10 meetings) isn't talent—it's tracking the right metrics and optimizing based on data. This guide breaks down the essential LinkedIn prospecting KPIs every SDR should monitor in 2026, complete with benchmarks from thousands of sales teams.
Whether you're an SDR trying to hit quota, a sales manager coaching your team, or a revenue leader building a predictable pipeline, understanding these metrics is critical to LinkedIn prospecting success.
Table of Contents
- Why LinkedIn Metrics Matter for SDRs
- The LinkedIn Prospecting Metrics Framework
- Activity Metrics: Measuring Your Inputs
- Engagement Metrics: Tracking Prospect Response
- Outcome Metrics: Pipeline and Revenue Impact
- Quality Metrics: Ensuring Sustainable Performance
- How to Track LinkedIn Prospecting Metrics
- Benchmarks by Industry and Company Size
- Common Metric Tracking Mistakes
- Optimizing Your LinkedIn Metrics
- Frequently Asked Questions
Why LinkedIn Metrics Matter for SDRs
LinkedIn has become the primary channel for B2B prospecting, with 80% of B2B social media leads coming from LinkedIn and 89% of B2B marketers using it for lead generation. But without proper metrics, you're flying blind.
The Cost of Not Tracking Metrics:
- SDRs waste 60-70% of time on low-value activities
- Managers can't coach effectively without data
- Teams miss quota by 30-50% due to poor targeting
- Revenue forecasting becomes guesswork
- Good performers can't replicate success
The Value of Data-Driven LinkedIn Prospecting:
- Identify bottlenecks quickly (is it targeting? messaging? follow-up?)
- Coach to specific behaviors that drive outcomes
- Predict pipeline 30-60 days in advance
- Optimize resource allocation across SDR team
- Scale what works, eliminate what doesn't
The most successful SDR teams review metrics daily (activity), weekly (engagement), and monthly (outcomes)—creating a feedback loop that drives continuous improvement.
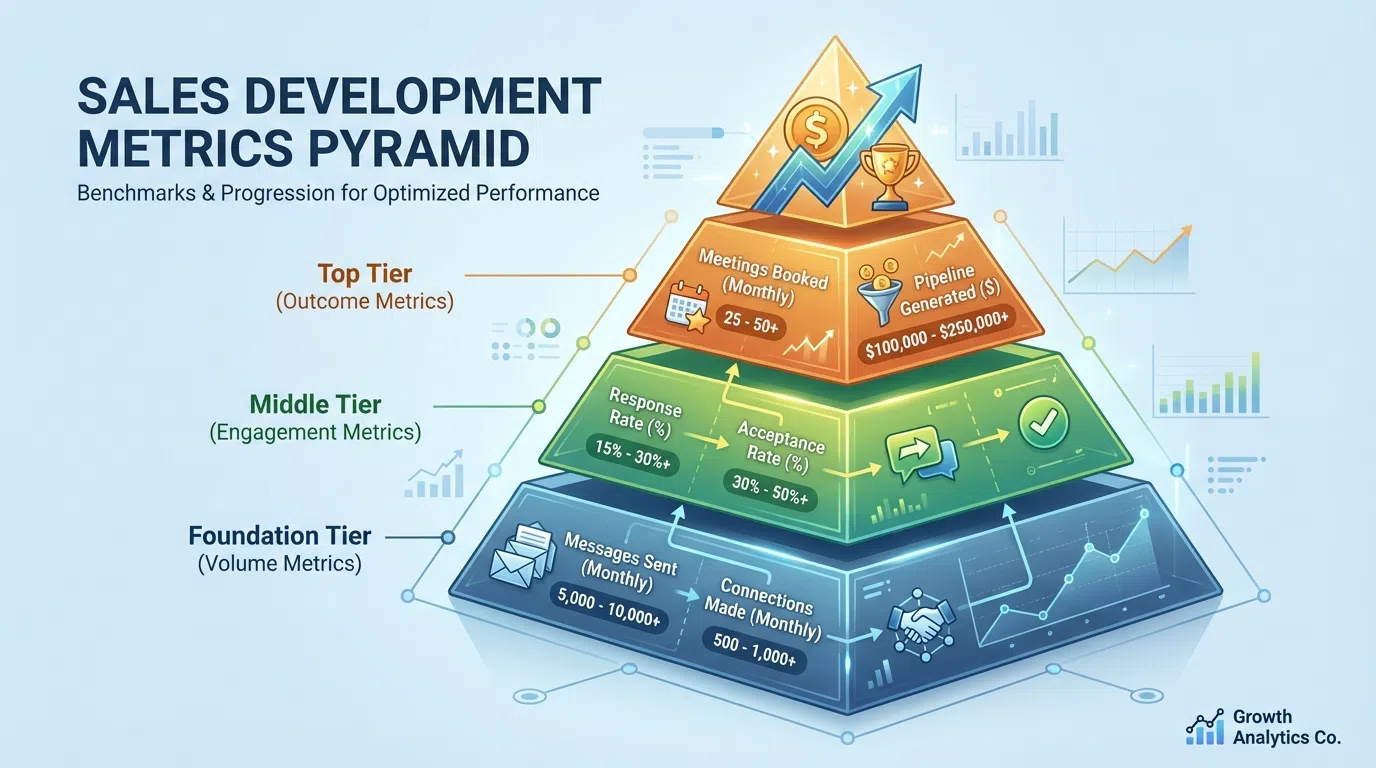
The LinkedIn Prospecting Metrics Framework
LinkedIn prospecting metrics fall into four categories, each serving a specific purpose:
1. Activity Metrics (Leading Indicators)
These measure your daily execution:
- Profile views sent
- Connection requests sent
- InMail messages sent
- Direct messages sent
- Follow-up messages sent
- Content engagements (likes, comments)
Purpose: Early warning system for pipeline problems. If activity drops, pipeline will drop 30-45 days later.
Frequency: Track daily, review weekly trends
2. Engagement Metrics (Mid-Funnel Indicators)
These measure prospect response:
- Connection acceptance rate
- Message response rate
- InMail response rate
- Profile views that lead to action
- Content engagement from prospects
- Reply-to-meeting conversion rate
Purpose: Quality indicator for targeting and messaging. Low engagement = wrong ICP or poor personalization.
Frequency: Track daily, analyze weekly for trends
3. Outcome Metrics (Lagging Indicators)
These measure business results:
- Meetings booked
- Meeting show-up rate
- SQLs generated (Sales Qualified Leads)
- Pipeline created
- Opportunities won
- Cost per meeting
Purpose: The metrics that actually matter for quota attainment and revenue generation.
Frequency: Track weekly, forecast monthly, review quarterly
4. Quality Metrics (Health Indicators)
These measure sustainability:
- Social Selling Index (SSI) score
- Profile completeness score
- Network growth rate
- Account health (warnings, restrictions)
- Message quality score
- Personalization rate
Purpose: Ensure long-term success and avoid account restrictions or penalties.
Frequency: Monthly reviews with quarterly deep-dives
The key is balancing all four categories—focusing only on outcomes ignores the leading indicators that predict future performance, while tracking only activity creates busy work without results.
Activity Metrics: Measuring Your Inputs
Profile Views Sent
What it measures: Number of LinkedIn profiles you view each day.
Why it matters: Profile views serve as soft touches that often prompt prospects to view your profile, creating familiarity before outreach.
Benchmarks:
- Minimum: 50 profile views/day
- Good: 100-150 views/day
- Excellent: 200-300 views/day (with Sales Navigator)
LinkedIn limits: 200-300 views/day (safe range to avoid restrictions)
Pro tip: View profiles 24-48 hours before sending connection requests to increase acceptance rates by 15-20%.
Connection Requests Sent
What it measures: Number of new connection requests sent daily/weekly.
Why it matters: Your network growth rate directly impacts future pipeline capacity. Each accepted connection becomes a warm lead you can message unlimited times.
Benchmarks:
- Minimum: 10-15 requests/day
- Good: 20-25 requests/day
- Excellent: 30-40 requests/day
LinkedIn limits:
- Official limit: 100/week (but this is outdated)
- Safe limit (2026): 20-25/day or 100-150/week
- Going over 30-40/day risks restrictions
Critical metric: Your connection acceptance rate should be 15-25% for cold outreach. If it drops below 15%, LinkedIn may throttle your account. Target 40-60% acceptance for warm outreach.
InMail Messages Sent
What it measures: Premium InMail credits used for outreach.
Why it matters: InMail bypasses the connection requirement, reaching decision-makers directly. With Sales Navigator, you get 50 InMail credits/month.
Benchmarks:
- Use all 50 credits monthly (don't waste them)
- Save InMail for high-value prospects (VPs, C-suite)
- Average InMail response rate: 10-25% vs 7-15% for connection messages
Cost efficiency: At $99/month for Sales Navigator, each InMail costs ~$2. With 10-25% response rates, that's $8-20 per response—expensive but worthwhile for enterprise prospects.
Direct Messages Sent (to Connections)
What it measures: First messages and follow-ups sent to existing connections.
Why it matters: This is your primary outreach channel once connections are accepted. No limits on messages to connections.
Benchmarks:
- Minimum: 30-50 messages/day
- Good: 50-100 messages/day
- Excellent: 100-200 messages/day (with AI personalization)
LinkedIn limits: Technically no limit to connections, but 50-100/day is safe to avoid spam flags. Messages should be personalized, not copy-paste.
Follow-up cadence: Plan 3-5 touches per prospect:
- Day 1: First message after connection
- Day 5-7: Follow-up (different angle)
- Day 12-14: Third touch (value-add)
- Day 21: Breakup message (often highest response)
Content Engagement Activity
What it measures: Likes, comments, shares on prospect and influencer content.
Why it matters: Warm engagement before outreach increases response rates by 27-35%. Engaging with prospects' posts makes you familiar before the ask.
Benchmarks:
- Minimum: 5-10 meaningful comments/day
- Good: 10-20 engagements/day
- Excellent: 20-30+ engagements/day
Strategy: Comment on prospects' posts 2-3 days before connection request. Reference their content in your outreach for 2-3x better response.
Engagement Metrics: Tracking Prospect Response
Connection Acceptance Rate
Formula: (Connections Accepted ÷ Connection Requests Sent) × 100
Why it matters: Your acceptance rate indicates targeting quality and message effectiveness. Low acceptance = wrong ICP or poor messaging.
Benchmarks:
- Poor: <15% (red flag—LinkedIn may restrict you)
- Average: 15-25% (cold outreach)
- Good: 25-40% (targeted outreach)
- Excellent: 40-60% (warm outreach with personalization)
By outreach type:
- Generic requests (no note): 10-15%
- Personalized cold outreach: 15-25%
- Warm outreach (2nd-degree): 40-60%
- Engaged with content first: 50-70%
Optimization: If below 20%, audit your targeting (wrong titles? industries?) and connection note quality (generic vs personalized?).
Message Response Rate
Formula: (Replies Received ÷ Messages Sent) × 100
Why it matters: The ultimate test of message quality and relevance. High response rates = strong value proposition and personalization.
Benchmarks:
- Poor: <5%
- Average: 5-10%
- Good: 10-20% (target range for most SDRs)
- Excellent: 20-30%
- Elite: 30-40%+ (with hyper-personalization)
By message type:
- Generic templates: 1-5%
- Basic personalization: 5-10%
- AI-assisted personalization: 10.3% (Closely benchmark)
- Hyper-personalized (LeadSpark AI): 70-90%
By channel:
- Connection request notes: Response measured by acceptance
- First message after connecting: 7-15% typical
- Follow-up messages: 5-12% (declining with each touch)
- InMail: 10-25% response rate
Pro tip: Messages under 400 characters get 22% higher response rates. Keep icebreakers concise—under 25 words ideal.
InMail Response Rate
Formula: (InMail Replies ÷ InMail Sent) × 100
Why it matters: InMail costs $1.50-2 per message, so low response rates are expensive. Track separately from regular messages.
Benchmarks:
Factors affecting InMail response:
- Subject line (25-40 characters optimal)
- Personalization quality
- Sender's profile optimization
- Prospect's activity level (active users respond 2-3x more)
- Timing (Tuesday-Thursday 8-10am best)
Cost per response: At 18% average response, each InMail response costs $11. At 25% (good), it drops to $8. Optimize for higher response to reduce cost.
Reply-to-Meeting Conversion Rate
Formula: (Meetings Booked ÷ Replies Received) × 100
Why it matters: Getting replies is great, but if they don't convert to meetings, you're not building pipeline.
Benchmarks:
- Poor: <20%
- Average: 20-40%
- Good: 40-60%
- Excellent: 60-80%
Typical conversation flow:
- Initial reply (question, objection, or interest)
- Your response (value proposition, answer objection)
- Their confirmation
- Meeting booked
Well-performing SDRs target 2-5% booked meeting ratio from initial outreach—meaning 2-5% of total prospects contacted eventually book meetings.
Optimization: If response rate is high (15-20%) but meeting booking is low (<30%), you're likely:
- Pitching too early (build rapport first)
- Not qualifying properly (booking wrong prospects)
- Weak value proposition (can't articulate why meet)
- Calendar link friction (make booking easy)
Outcome Metrics: Pipeline and Revenue Impact
Meetings Booked per Month
What it measures: Total discovery calls, demos, or meetings scheduled with qualified prospects.
Why it matters: This is the primary SDR metric. A good benchmark is 10-20 meetings per SDR monthly for most B2B teams.
Benchmarks by company stage:
- Startup/early-stage: 5-10 meetings/month (niche targeting)
- Growth-stage: 10-20 meetings/month (standard)
- Enterprise: 15-25 meetings/month (optimized process)
By deal size:
- Enterprise ($100K+ deals): 5-10 meetings/month (deep research required)
- Mid-market ($10-100K): 10-20 meetings/month (balanced approach)
- SMB ($1-10K): 20-40 meetings/month (high volume)
Calculation: If you contact 400 prospects/month and book 16 meetings, that's a 4% booking rate—solid performance.
Pro tip: Track meetings booked vs attended. Aim for 60-80% show-up rate. Below 50% indicates targeting issues.
Meeting Show-Up Rate
Formula: (Meetings Attended ÷ Meetings Booked) × 100
Why it matters: No-shows waste AE time and indicate poor qualification. High no-show rates kill team morale.
Benchmarks:
- Poor: <50% (major qualification problem)
- Average: 50-60%
- Good: 60-80%
- Excellent: 80-90%
Factors affecting show-up rates:
- Qualification quality (did you verify need/timeline/budget?)
- Booking confirmation process (email reminder 24 hours before)
- Value proposition clarity (do they know why they're meeting?)
- Calendar friction (too many steps to book = higher no-shows)
Optimization tactics:
- Send confirmation email immediately after booking
- Text/LinkedIn reminder 24 hours before
- Personalized meeting agenda in confirmation
- Clear value statement ("We'll show you how to...")
SQLs Generated (Sales Qualified Leads)
What it measures: Meetings that convert to qualified opportunities worth pursuing.
Why it matters: Not all meetings are equal. SQLs represent real pipeline potential based on BANT (Budget, Authority, Need, Timeline) or similar qualification framework.
Benchmarks:
- Aim for 20-30% close-won rate of SQLs
- MQL-to-SQL conversion: 12-21% average, 40% for top SaaS performers
SQL criteria (vary by company):
- Decision-maker or influencer on call
- Clear pain point that your solution addresses
- Budget allocated or accessible within 6-12 months
- Timeline for implementation (ideally <90 days)
Tracking: If you book 20 meetings and 12 qualify as SQLs (60% SQL rate), you're doing well. If only 5-6 qualify (25-30%), your targeting needs work.
Pipeline Created
What it measures: Total dollar value of opportunities generated from your LinkedIn prospecting.
Why it matters: The ultimate metric for SDR contribution to revenue goals.
Benchmarks by SDR:
- SMB-focused: $20-50K pipeline/month
- Mid-market: $50-150K pipeline/month
- Enterprise: $100-500K pipeline/month
Calculation example:
- 15 meetings booked
- 9 qualify as SQLs (60% SQL rate)
- Average deal size: $15K
- Pipeline created: 9 × $15K = $135K
Tracking period: Most teams measure pipeline created with 30-90 day lag (time from meeting to opportunity stage).
Cost per Meeting
Formula: (Total LinkedIn Prospecting Costs ÷ Meetings Booked)
Why it matters: Efficiency metric for resource allocation and ROI justification.
Cost components:
- Sales Navigator: $99-149/month per user
- AI personalization tools (LeadSpark AI): $49-297/month
- Data enrichment tools: $50-500/month
- SDR salary allocation: ~$5K-7K/month (fully loaded)
Benchmarks:
- High-touch manual: $200-400 per meeting
- AI-assisted: $100-200 per meeting
- Optimized with AI personalization: $50-100 per meeting
Example calculation:
- Costs: $149 Sales Navigator + $97 LeadSpark AI + $5,500 SDR = $5,746/month
- Meetings booked: 20/month
- Cost per meeting: $287 (good performance)
If cost per meeting exceeds $500, efficiency improvements needed (better targeting, AI tools, process optimization).
Quality Metrics: Ensuring Sustainable Performance
Social Selling Index (SSI) Score
What it measures: LinkedIn's proprietary score (0-100) measuring your effectiveness across four pillars:
- Establish your professional brand (profile optimization)
- Find the right people (targeting)
- Engage with insights (content interaction)
- Build relationships (network growth and engagement)
Why it matters: Sales professionals with strong SSI have 45% more sales opportunities than those with weak scores. LinkedIn's algorithm favors high-SSI users.
Benchmarks:
- Poor: <40
- Average: 40-60
- Good: 60-75
- Excellent: 75-100
Check your SSI: Visit linkedin.com/sales/ssi (requires Sales Navigator)
Improving SSI:
- Complete profile 100% (photo, headline, summary, experience)
- Post content 2-3x/week
- Engage with others' posts daily (5-10 meaningful comments)
- Grow network strategically (20-30 connections/week)
- Use Sales Navigator features regularly
Profile Completeness Score
What it measures: Percentage of LinkedIn profile sections completed.
Why it matters: Incomplete profiles reduce connection acceptance by 30-40%. Prospects check your profile before accepting—make it compelling.
Elements to complete:
- Professional photo (profiles with photos get 21x more views)
- Background image (branded or professional)
- Headline (focus on value you provide, not just title)
- About section (written for prospects, not recruiters)
- Experience with accomplishments
- Skills (top 5 relevant to prospects)
- Recommendations (5+ from diverse connections)
- Featured content (case studies, articles, value-add resources)
Target: 100% profile completeness, optimized for your ICP
Network Growth Rate
Formula: (New Connections ÷ Existing Connections) × 100 (monthly)
Why it matters: Healthy network growth expands your reach and indicates sustainable prospecting.
Benchmarks:
- Stagnant: <2% monthly growth
- Healthy: 3-5% monthly growth
- Aggressive: 5-10% monthly growth
Example: If you have 2,000 connections and add 100/month, that's 5% growth—healthy pace.
Watch out for: Declining growth rates often precede pipeline drops 30-60 days later.
Account Health (Restrictions/Warnings)
What it measures: LinkedIn warnings, temporary restrictions, or account issues.
Why it matters: Account restrictions kill prospecting momentum. Prevention is critical.
Red flags:
- Connection request acceptance rate <15%
- Rapid activity spikes (0 to 100 requests/day)
- Copy-paste generic messages
- Exceeding daily limits (30-40 requests, 100 messages)
- Automation tool detection
Avoiding restrictions:
- Stay within safe limits (20-25 requests/day)
- Personalize every message
- Use AI tools like LeadSpark AI for research, not automation
- Vary activity patterns (don't send all requests at 9am)
- Monitor acceptance rate weekly
If restricted: Wait out the restriction period (7-30 days), then reduce activity by 30-50% and increase personalization.
How to Track LinkedIn Prospecting Metrics
Manual Tracking (Spreadsheet Method)
Best for: Solo SDRs, small teams, getting started
Setup:
- Create daily tracking spreadsheet
- Columns: Date, Profile Views, Requests Sent, Messages Sent, Replies, Meetings Booked
- Track at end of each day (5-10 minutes)
- Weekly rollup tab calculating rates
Pros: Simple, free, full control
Cons: Time-consuming, error-prone, limited analysis
CRM Integration
Best for: Teams of 3+ SDRs, growing companies
Popular CRMs:
- HubSpot (best for small-mid teams, free tier available)
- Salesforce (enterprise standard)
- Pipedrive (SMB-friendly, affordable)
Setup:
- Log all LinkedIn activities in CRM
- Create custom fields for LinkedIn-specific metrics
- Build dashboards for team visibility
- Weekly/monthly reports automated
Pros: Centralized data, team visibility, historical trends
Cons: Requires discipline to log activities, setup time
LinkedIn Sales Navigator Built-In Analytics
Best for: All SDRs using Sales Navigator
Included metrics:
- InMail response rates
- Profile views
- Search appearances
- Social Selling Index
Access: Sales Navigator > Insights & Analytics
Pros: Automated, LinkedIn-native data
Cons: Limited to Sales Navigator data, no cross-channel view
Third-Party Analytics Tools
Best for: Data-driven teams, agencies managing multiple clients
Tools to consider:
- Shield Analytics: LinkedIn post performance
- Salesflow: Prospecting automation + analytics
- Expandi: Campaign analytics with A/B testing
- Closely: Multi-channel analytics
Pros: Advanced analytics, automation tracking, A/B testing
Cons: Additional cost ($50-200/month), learning curve
Recommended Hybrid Approach
Most successful teams use:
- Sales Navigator: Basic LinkedIn metrics (free with subscription)
- CRM: Central system of record for all activities
- LeadSpark AI: Track personalization quality and response rates
- Weekly spreadsheet review: Team rollup and trends
This provides complete visibility without overwhelming complexity.
Benchmarks by Industry and Company Size
LinkedIn prospecting performance varies by industry and company size:
By Industry
Technology/SaaS (most responsive):
- Connection acceptance: 25-35%
- Message response: 12-20%
- Meetings booked: 15-25/month per SDR
- Why higher: Tech professionals live on LinkedIn, familiar with sales outreach
Professional Services (consultants, agencies):
- Connection acceptance: 30-40%
- Message response: 15-25%
- Meetings booked: 12-18/month per SDR
- Why higher: Relationship-driven, open to networking
Manufacturing/Industrial:
- Connection acceptance: 15-25%
- Message response: 8-15%
- Meetings booked: 8-12/month per SDR
- Why lower: Less active on LinkedIn, longer sales cycles
Healthcare:
- Connection acceptance: 20-30%
- Message response: 10-18%
- Meetings booked: 10-15/month per SDR
- Why variable: Compliance concerns, but relationship-driven
Financial Services:
- Connection acceptance: 18-28%
- Message response: 8-12%
- Meetings booked: 8-12/month per SDR
- Why lower: Regulatory caution, skeptical of outreach
By Company Size (Target)
Enterprise (1,000+ employees):
- Connection acceptance: 15-25%
- Response rate: 8-15%
- Multi-stakeholder complexity
- Longer sales cycles (6-12 months)
- SDR target: 8-12 meetings/month
Mid-Market (100-1,000 employees):
- Connection acceptance: 25-35%
- Response rate: 15-25%
- Decision-makers accessible
- Moderate sales cycles (3-6 months)
- SDR target: 12-20 meetings/month
SMB (<100 employees):
- Connection acceptance: 30-40%
- Response rate: 20-30%
- Fast decision-making
- Short sales cycles (1-3 months)
- SDR target: 20-30 meetings/month
Adjust expectations based on your ICP and industry. A healthcare SDR targeting enterprise accounts should expect 8-10 meetings/month, not 20.
Common Metric Tracking Mistakes
1. Tracking Activity Instead of Outcomes
Mistake: Celebrating "sent 500 messages this week" without measuring responses or meetings.
Why it's wrong: Activity without results is just busy work. You can send 1,000 messages with 1% response (10 replies) or 100 messages with 30% response (30 replies). The latter wins.
Fix: Track both activity (leading indicator) and outcomes (lagging indicator). If activity is high but outcomes low, you have a quality problem.
2. Not Segmenting Metrics
Mistake: Treating all prospects the same in reporting (mixing enterprise, mid-market, SMB).
Why it's wrong: Different ICPs have different benchmarks. Averaging hides performance issues.
Fix: Segment reporting by:
- Company size
- Industry
- Job title/seniority
- Warm vs cold outreach
- Message type (connection request, InMail, DM)
3. Focusing on Vanity Metrics
Mistake: Obsessing over SSI score or profile views without connecting to business outcomes.
Why it's wrong: SSI correlates with success but doesn't cause it. You can have high SSI with zero pipeline.
Fix: Use quality metrics (SSI, profile completeness) as health checks, but optimize for meetings booked and pipeline created.
4. Not Tracking Fast Enough
Mistake: Monthly metric reviews only—missing weekly trends.
Why it's wrong: By the time you see a monthly drop, you've lost 3-4 weeks of productivity.
Fix: Daily activity logging, weekly engagement review, monthly outcome analysis. Catch problems in days, not months.
5. Ignoring Benchmark Comparisons
Mistake: Tracking metrics in isolation without comparing to benchmarks or team averages.
Why it's wrong: You don't know if 15% response rate is good or bad without context.
Fix: Compare to:
- Industry benchmarks (this guide)
- Team average (am I above/below?)
- Your historical performance (trending up/down?)
- Top performer on team (what are they doing differently?)
Optimizing Your LinkedIn Metrics
Data without action is worthless. Here's how to improve key metrics:
Improving Connection Acceptance Rate (Target: 25-40%)
If below 20%:
- Audit your ICP targeting: Are you connecting with the right titles? Industries? Company sizes? Tighten filters.
- Personalize connection notes: Reference their profile, content, or mutual connections. Personalized requests get 200% higher acceptance.
- Engage before requesting: View profile, like post, comment 2-3 days before requesting.
- Optimize your profile: Prospects check before accepting—make yours compelling.
- Target 2nd-degree connections: 40-60% acceptance vs 15-25% for 3rd-degree.
Tools: LeadSpark AI generates personalized connection notes in seconds based on profile analysis.
Improving Message Response Rate (Target: 10-20%+)
If below 10%:
- Hyper-personalize messages: Reference specific posts, achievements, or pain points. Generic = ignored.
- Keep messages short: Under 400 characters = 22% better response. Target under 25 words for icebreakers.
- Lead with value: "I can help you X" beats "I want to sell you Y" every time.
- Test different angles: Pain point, achievement compliment, shared interest, mutual connection.
- Time your messages: Tuesday-Thursday 8-10am or 12-1pm for best response.
Tools: LeadSpark AI achieves 70-90% response rates by analyzing recent posts for contextual hooks.
Improving Meeting Booking Rate (Target: 10-20 meetings/month)
If below 10:
- Increase activity: If response rate is good (10-15%) but meetings are low, you need more volume.
- Improve qualification: Ask qualifying questions before proposing meeting (budget, timeline, authority).
- Stronger CTAs: "Grab 15 minutes Thursday?" beats "Let me know if you're interested."
- Remove friction: Use calendar link (Calendly, HubSpot) for instant booking.
- Multi-touch follow-up: 80% of meetings come from 5+ touches—persistence wins.
Calculation: To book 15 meetings/month with 10% response rate and 40% reply-to-meeting conversion:
- Need 375 prospects contacted (375 × 10% = 37.5 responses × 40% = 15 meetings)
- That's ~95 prospects/week or 19/day
- Achievable with AI personalization tools
Improving Meeting Show-Up Rate (Target: 60-80%)
If below 60%:
- Better qualification: If they're not sure why they're meeting, they won't show.
- Send confirmation: Email immediately after booking with meeting purpose and agenda.
- 24-hour reminder: LinkedIn message or text reminder day before.
- Clearer value prop: "In 20 minutes, I'll show you how to reduce SDR ramp time by 50%" vs "Let's chat about your SDR team."
- Easier rescheduling: Make it simple to reschedule vs ghosting.
Frequently Asked Questions
What's a good LinkedIn response rate for cold outreach?
For cold outreach, 10-20% response rate is the target range for most SDRs. Generic templates achieve 1-5%, basic personalization gets 5-10%, and advanced AI personalization like LeadSpark AI delivers 70-90%.
Factors affecting response rates:
- ICP fit (right target = 2-3x better response)
- Message personalization (specific beats generic)
- Timing (Tuesday-Thursday mornings best)
- Sender profile quality (complete, professional)
- Prior engagement (commenting on posts first)
If you're below 10%, focus on targeting and message quality before increasing volume.
How many LinkedIn connections should I send per day?
Safe limit in 2026: 20-25 connections per day or 100-150 per week.
LinkedIn's official limit is 100/week, but aggressive sending (30-40/day) risks account restrictions. The key threshold is connection acceptance rate—if it drops below 15%, LinkedIn may throttle your account.
Strategy:
- Start conservative: 10-15/day for first 2 weeks
- Monitor acceptance rate weekly
- If acceptance stays above 25%, increase to 20-25/day
- Never exceed 30-40/day even if acceptance is high
Quality beats quantity—25 personalized requests with 40% acceptance (10 new connections) beats 50 generic requests with 15% acceptance (7.5 connections).
Should I track SSI score?
Yes, but don't obsess over it. SSI correlates with 45% more sales opportunities, but it's a health metric, not an outcome metric.
Track SSI:
- Monthly check-in (not daily)
- Target 60-75+ for active prospectors
- Improve through profile optimization, content posting, engagement, network growth
Don't make SSI your primary KPI—pipeline created and meetings booked matter more. Think of SSI like a health checkup: important to monitor, but not the goal itself.
What's the best CRM for tracking LinkedIn metrics?
Depends on your team size and budget:
For solopreneurs/startups: HubSpot Free CRM
- Free forever
- LinkedIn Sales Navigator integration
- Custom properties for LinkedIn metrics
- Basic reporting
For small-mid teams (3-20 SDRs): HubSpot Pro or Pipedrive
- Advanced reporting and dashboards
- Workflow automation
- Team visibility
- $50-800/month
For enterprise (20+ SDRs): Salesforce
- Most robust integration ecosystem
- Advanced analytics and AI
- Complete customization
- $1,200-2,000+/year per user
All integrate with LinkedIn Sales Navigator and tools like LeadSpark AI for comprehensive tracking.
How do I calculate ROI on LinkedIn prospecting?
Simple ROI Formula:
ROI = (Revenue Generated - Costs) ÷ Costs × 100
Example calculation:
- Costs per month:
- SDR salary (allocated): $5,500
- Sales Navigator: $149
- LeadSpark AI: $97
- Total: $5,746
- Results:
- Meetings booked: 18
- SQLs generated: 11 (61% SQL rate)
- Closed deals: 3 (27% close rate)
- Average deal size: $15,000
- Revenue: $45,000
- ROI: ($45,000 - $5,746) ÷ $5,746 × 100 = 683% ROI
Advanced: Track pipeline created (not just closed), assign probability to stages, calculate expected value.
Most teams measure "cost per meeting" ($5,746 ÷ 18 = $319) as a leading indicator before deals close.
How often should I review LinkedIn metrics?
Daily (5 minutes):
- Activity metrics (requests sent, messages sent)
- Quick response rate check
- Flag any unusual drops
Weekly (30 minutes):
- Engagement metrics (acceptance rate, response rate)
- Meetings booked this week
- Compare to previous week and identify trends
Monthly (1-2 hours):
- Outcome metrics (SQLs, pipeline created)
- Quality metrics (SSI, account health)
- Benchmark against team and industry
- Strategic adjustments (targeting, messaging, tools)
Quarterly (half-day):
- Full performance review
- ROI calculation
- Tool stack evaluation
- Process optimization
- Goal setting for next quarter
Top-performing SDRs treat metrics like a daily dashboard—quick checks daily prevent monthly surprises.
Ready to Optimize Your LinkedIn Prospecting Metrics?
Tracking the right metrics is the foundation of scalable LinkedIn prospecting. But collecting data is pointless if you're not optimizing the inputs that drive outcomes.
The SDRs hitting 15-25 meetings monthly aren't working harder—they're working smarter:
- They target the right prospects (20-25% acceptance rates vs 10-15%)
- They personalize at scale (10-20% response vs 1-5% generic)
- They track activity, engagement, and outcomes daily
- They use AI tools like LeadSpark AI to achieve 70-90% response rates
Most importantly, they understand the connection between leading indicators (activity), mid-funnel metrics (engagement), and lagging indicators (meetings booked, pipeline created).
If you're tracking metrics manually and spending 8-14 minutes per prospect on research, it's time to automate. LeadSpark AI analyzes LinkedIn profiles and recent posts in 5-10 seconds, generating hyper-personalized icebreakers that achieve 70-90% response rates—allowing you to scale from 30 prospects/day to 200+ while maintaining quality.
Start tracking better metrics with LeadSpark AI →
Get 15 free credits to test AI-powered personalization on your prospects. No credit card required.
Related Posts
- How to Scale LinkedIn Outreach Without Sacrificing Quality
- LinkedIn Response Rate Benchmarks: What's a Good Reply Rate in 2026?
- Building an SDR Tech Stack in 2026: Essential Tools
- Best AI Sales Tools for SDRs in 2026: Complete Tech Stack
Sources:
- LinkedIn Statistics 2026: Global Trends & Social Selling Data – Martal Group
- 5 KPIs To Track When Prospecting On LinkedIn – Roman Rose
- 10 B2B Sales KPIs Every Revenue Team Should Track in 2026 – Cleverly
- SDR KPIs: Guide to Boosting Sales Pipeline Success – Martal Group
- Top KPIs for LinkedIn Prospecting Success – LeadsForge
Ready to Generate Personalized Icebreakers?
Join sales professionals using LeadSpark AI to create hyper-personalized LinkedIn icebreakers in minutes.